Ripple is consolidating above the $0.1720 support zone against the US Dollar. XRP price seems to be preparing for a fresh rally, but it must surpass $0.1800 for a sustained upward move.
- Ripple is slowly rising and it is currently trading above $0.1750 against the US dollar.
- The price is likely to face hurdles near $0.1780, $0.1800, and the 100 hourly SMA.
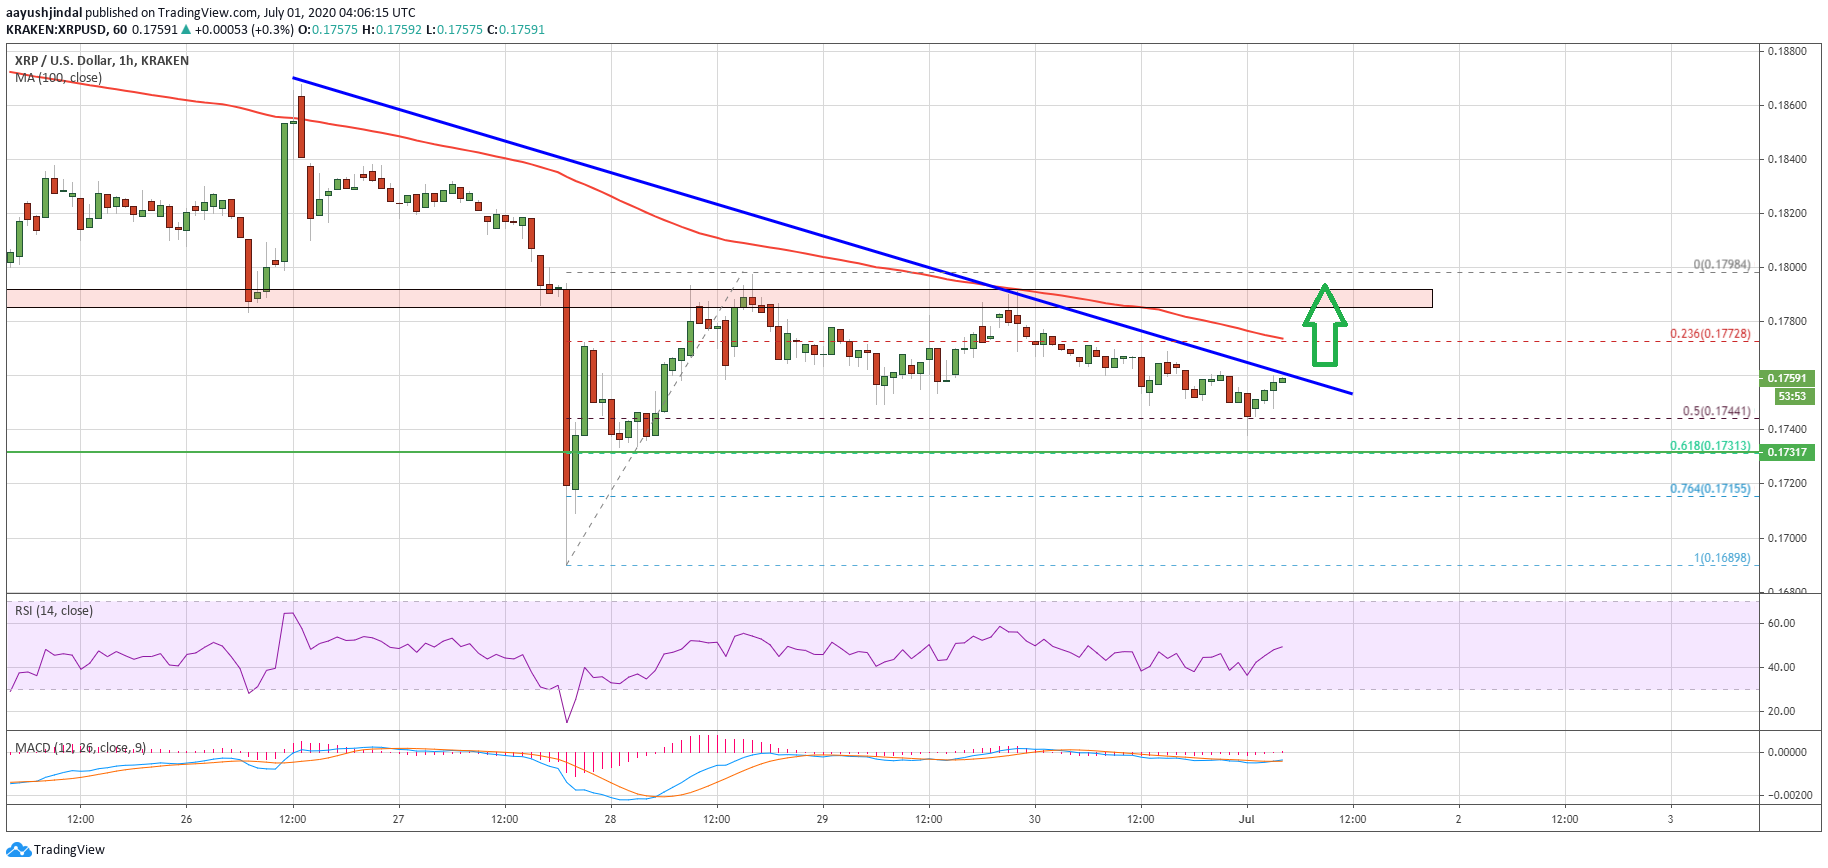
- There is a major bearish trend line forming with resistance near $0.1760 on the hourly chart of the XRP/USD pair (data source from Kraken).
- The pair could start a fresh rally if there is a successful close above the $0.1800 resistance.
Ripple Price Could Rally Above $0.1800
After a downward spike below the $0.1700 level, ripple found support above $0.1680. XRP price started an upside correction and recovered above the $0.1720 resistance level.
The bulls were able to push the price above the $0.1780 resistance, but they struggled to clear the $0.1800 level and the 100 hourly simple moving average. A swing high was formed near $0.1798 before the pair started correcting lower.
It traded below the $0.1760 level, plus the 23.6% Fib retracement level of the upward move from the $0.1689 low to $0.1798 high. It is currently holding the $0.1720 support level and showing positive signs.
The 50% Fib retracement level of the upward move from the $0.1689 low to $0.1798 high is also a strong support at $0.1745. On the upside, the price is likely to face hurdles near $0.1780, $0.1800, and the 100 hourly SMA.
Ripple price below $0.1800. Source: TradingView.com
There is also a major bearish trend line forming with resistance near $0.1760 on the hourly chart of the XRP/USD pair. If the bulls clear the trend line resistance, the price could continue to rise towards the $0.1800 resistance.
A successful daily close above the $0.1800 level and the 100 hourly simple moving average could spark a fresh rally in the coming sessions.
More Losses in XRP?
If ripple price struggles to clear the $0.1780 and $0.1800 resistance levels, there is a risk of another decline. An initial support is near the $0.1740 level.
The main support is near the $0.1720 level, below which the price is likely to accelerate lower towards the $0.1680 and $0.1650 levels in the near term.
Technical Indicators
Hourly MACD – The MACD for XRP/USD is slowly moving back into the bullish zone.
Hourly RSI (Relative Strength Index) – The RSI for XRP/USD is rising and it is approaching the 50 level.
Major Support Levels – $0.1740, $0.1720 and $0.1680.
Major Resistance Levels – $0.1780, $0.1800 and $0.1880.
Take advantage of the trading opportunities with Plus500
Risk disclaimer: 76.4% of retail CFD accounts lose money.
from NewsBTC https://ift.tt/3eV2w68

Comments
Post a Comment