- ETH price traded to a new 2019 high close to $290 and declined heavily against the US Dollar.
- The price reversed most its gains and traded below the $260 and $250 support levels.
- There was a break below a major bullish trend line with support at $266 on the hourly chart of ETH/USD (data feed via Kraken).
- The pair tested the $240 level and it is currently correcting higher towards the $260 and $264 resistances.
Ethereum price declined heavily below $260 versus the US Dollar, but remained flat vs bitcoin. ETH price is currently correcting higher, but it could face a strong resistance near the $265 area.
Ethereum Price Analysis
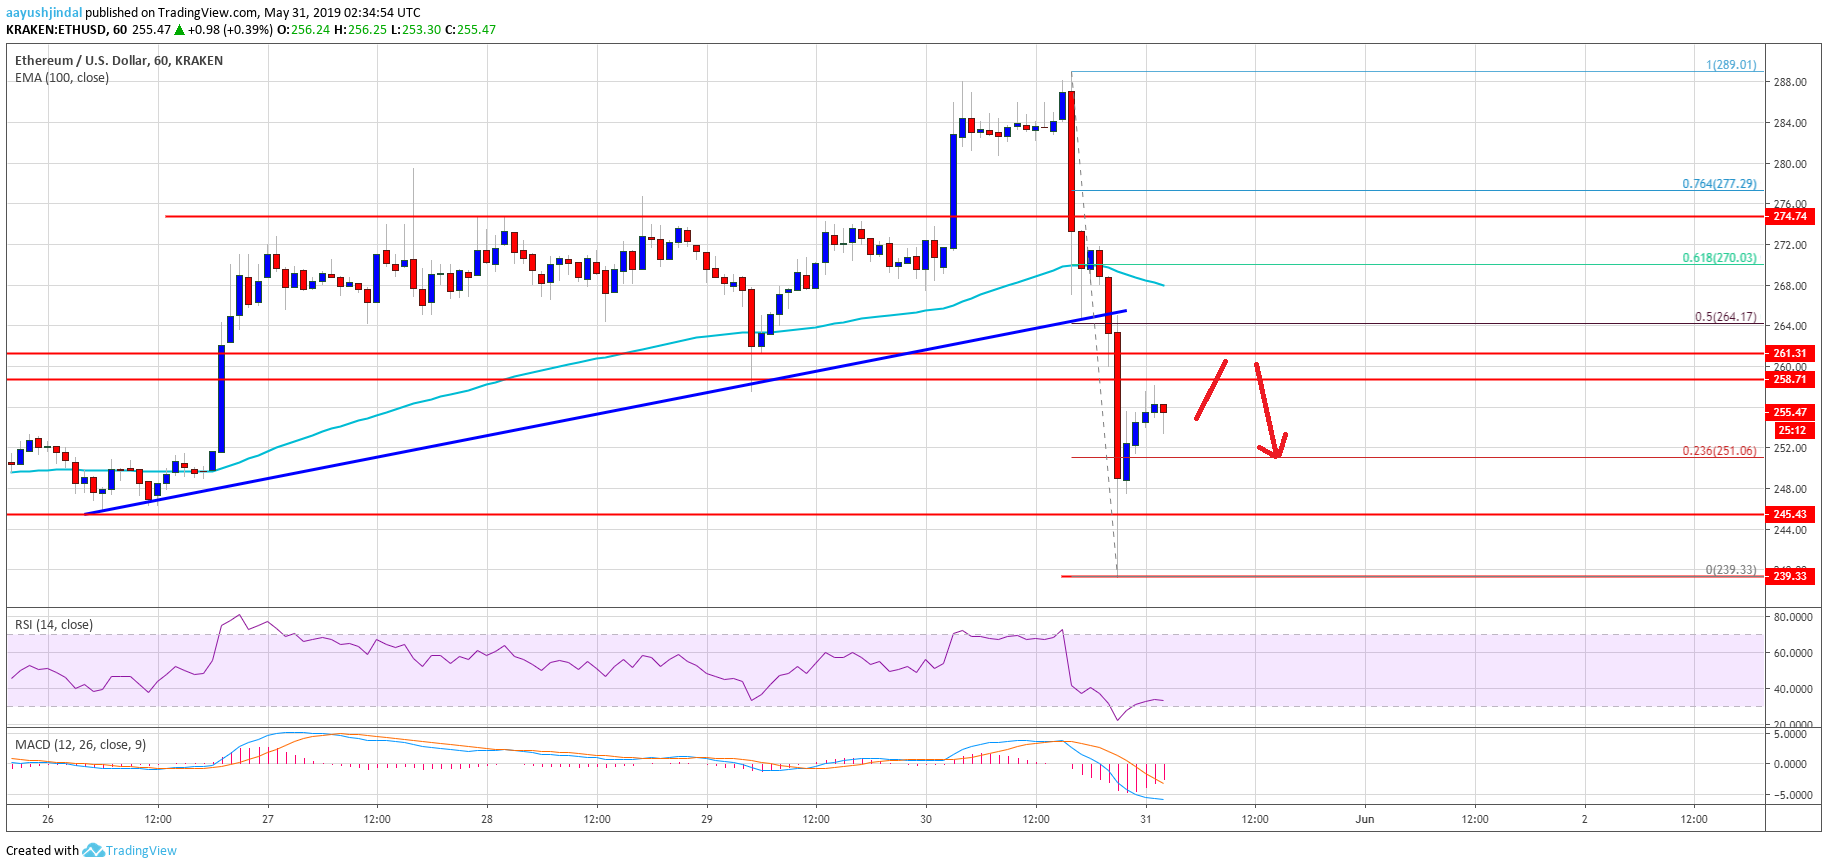
Yesterday, there were further gains in Ethereum price above the $280 level against the US Dollar. The ETH/USD pair even broke the last swing high and traded to a new 2019 high near $290. However, the bulls failed to gain momentum and the price declined sharply below $280. There was a major downward move below the $270 and $265 support levels. The price even settled below the $265 level and the 100 hourly simple moving average.
Moreover, there was a break below a major bullish trend line with support at $266 on the hourly chart of ETH/USD. Finally, there was a spike below the $245 support level. A swing low was formed near $240 and the price is currently correcting higher. It moved above the 23.6% Fib retracement level of the recent decline from the $290 high to $240 low. However, there are many hurdles on the upside near the $262 and $265 levels (the recent support zones).
Besides, the 50% Fib retracement level of the recent decline from the $290 high to $240 low is also near the $264 level to prevent gains. The price is likely to struggle to surpass the $264 level and there is a risk of a fresh decline. On the downside, an immediate support is near the $252 level, below which the price might trade towards the $245 support area.
Looking at the chart, Ethereum price is clearly trading near a crucial juncture below $265. As long as there is no close above $265, there is a risk of another drop. On the downside, the main support is at $245, below which the price could even break the $240 level and trade further lows. The next main support is near the $232 level, where the bulls may emerge.
ETH Technical Indicators
Hourly MACD – The MACD for ETH/USD is slowly reducing its bearish slope, with many negative signs.
Hourly RSI – The RSI for ETH/USD is currently recovering from the oversold readings and remain well below the 50 level.
Major Support Level – $245
Major Resistance Level – $265
The post Ethereum (ETH) Price Reversed Gains: Support Turned Resistance appeared first on NewsBTC.
from NewsBTC http://bit.ly/2VXY0JC

Comments
Post a Comment