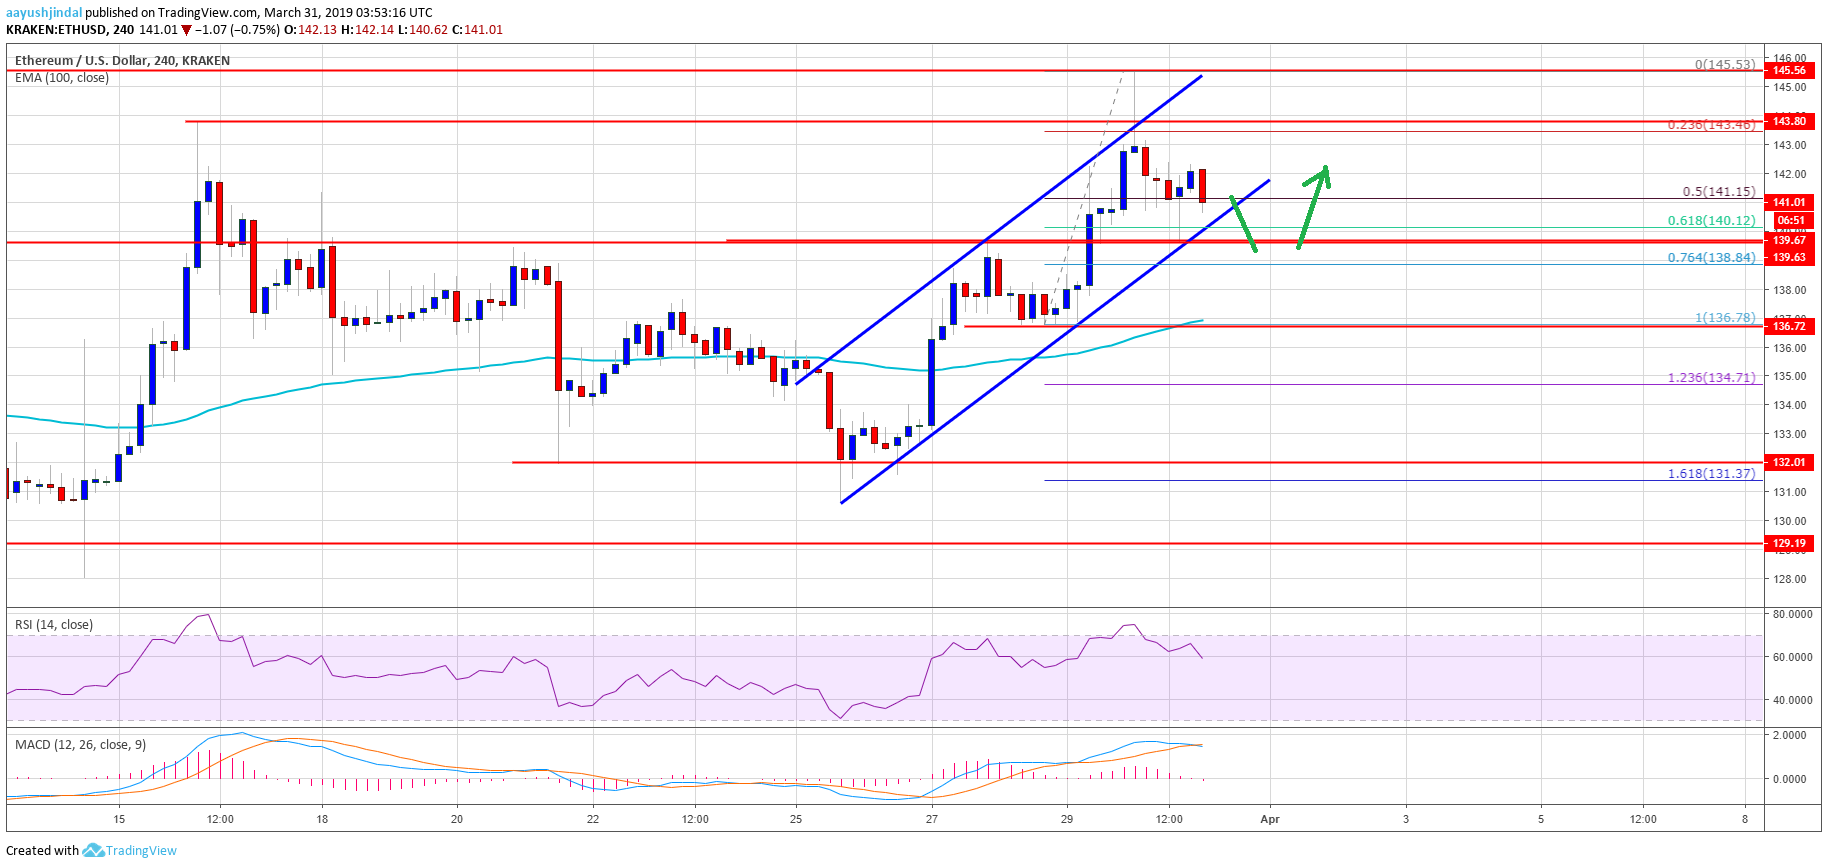
- ETH price rallied in the past few days and broke the $139 and $144 resistances against the US Dollar.
- The price is currently correcting lower, but it could find a strong support near the $139 zone.
- There is a major ascending channel in place with support at $140 on the 4-hours chart of ETH/USD (data feed via Kraken).
- The pair remains in an uptrend as long as there is no daily close below the $139 support zone.
Ethereum price is placed in a solid uptrend versus the US Dollar and Bitcoin. ETH/USD could test the $139 support area before it starts a fresh bullish wave above $144.
Ethereum Price Analysis
This past week, ETH price formed a solid support base near the $137 level against the US Dollar. The ETH/USD pair started a solid upside move and traded above the $139 and $142 resistance levels. There was a successful close above the $139 level and the 100 simple moving average (4-hours). It cleared the path for more gains and the price traded above the $144 resistance area. It traded close to the $146 resistance level and later started a substantial downside correction.
The price traded below the $142 level and the 50% Fib retracement level of the last wave from the $137 low to $145 swing high. However, the price found a strong buying interest above the key $139 support area. Moreover, there is a major ascending channel in place with support at $140 on the 4-hours chart of ETH/USD. The 61.8% Fib retracement level of the last wave from the $137 low to $145 swing high also acted as a support. The price recovered, but the $142 area is acting as a hurdle.
It seems like there could be another dip in ETH price below the $140 level. However, the $139 support zone is likely to act as a crucial buy zone. As long as there is no daily close below the $139 level, the price is likely to bounce back in the near term.

The above chart indicates that ETH price is clearly placed in an uptrend, but bulls need to prevent the $139 support area. On the upside, a break above the $142 and $144 levels is needed for more gains. The next key resistance is near $146, above which the price is likely to test the $150 resistance level.
Technical Indicators
4 hours MACD – The MACD for ETH/USD is slowly moving in the bearish zone, with a few negative signs.
4 hours RSI – The RSI for ETH/USD is currently correcting lower from the 75 level and it could test 55.
Major Support Level – $139
Major Resistance Level – $144
The post Ethereum Price Weekly Analysis: Can ETH Bulls Keep Uptrend Going? appeared first on NewsBTC.
from NewsBTC https://ift.tt/2HOVPFC
Comments
Post a Comment