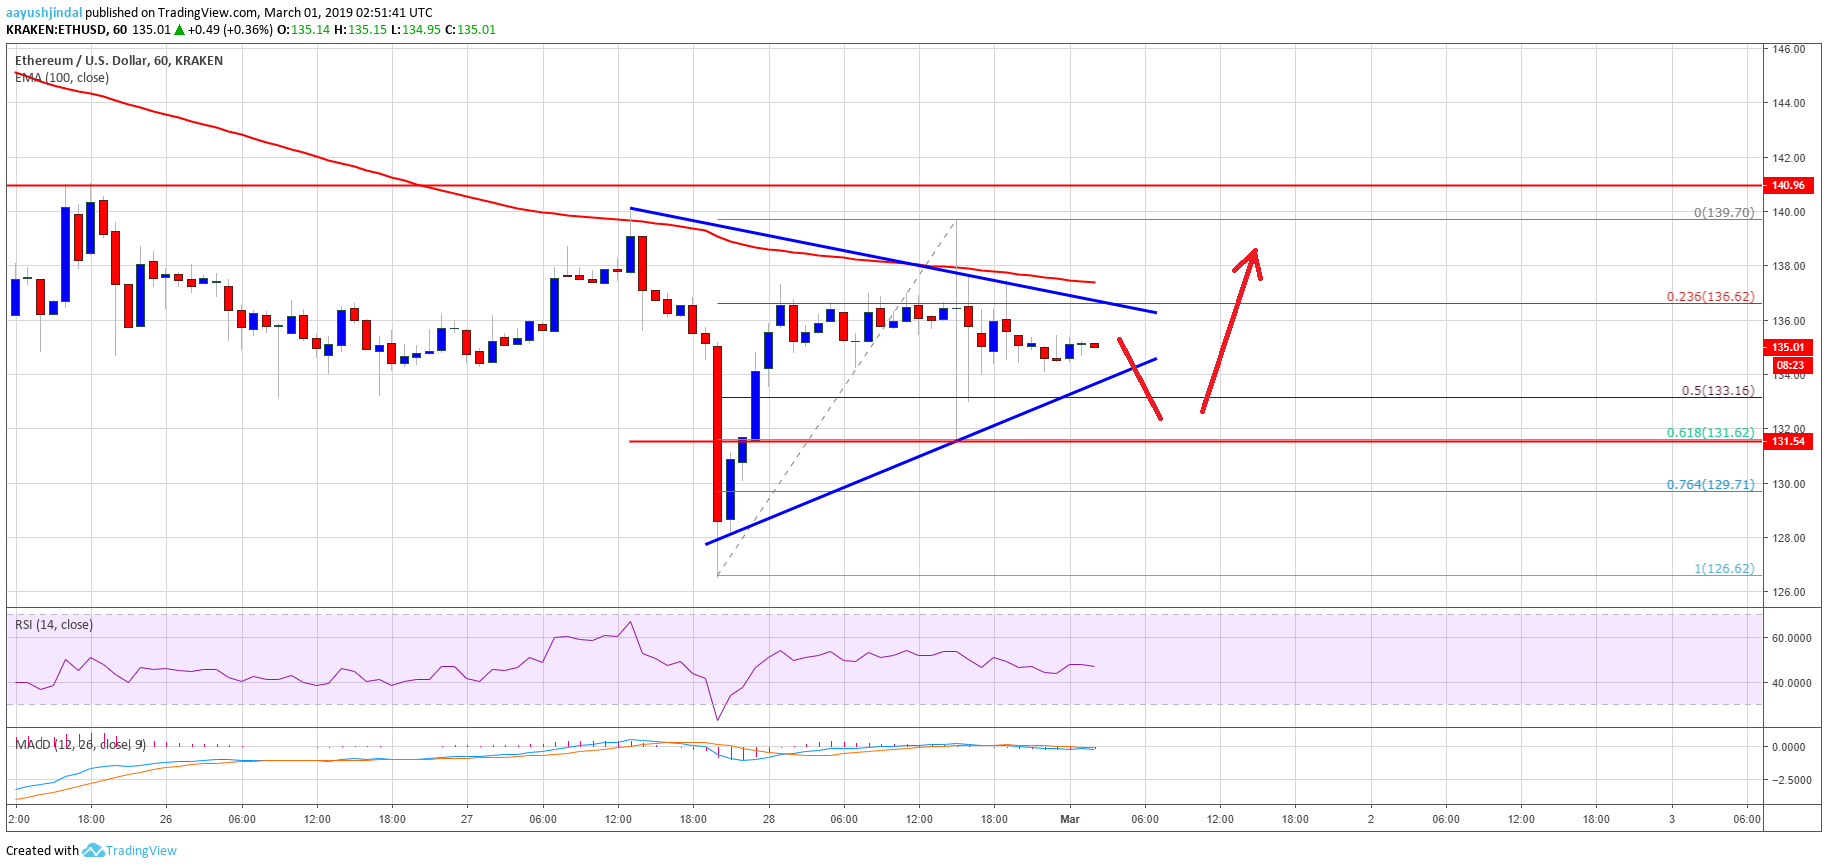
- ETH price recovered recently and traded above the $130 and $132 support levels against the US Dollar.
- The price seems to be struggling near the $137 resistance and the 100 hourly simple moving average.
- There is a short term breakout pattern formed with resistance at $136 on the hourly chart of ETH/USD (data feed via Kraken).
- The pair is likely to make the next move either above the $137 resistance or towards the $130 support.
Ethereum price is consolidating before the next move against the US Dollar and bitcoin. ETH/USD could gain bullish momentum once it clears the $137 and $140 resistance levels.
Ethereum Price Analysis
Yesterday, we saw a few swing moves in ETH price near the $130 level against the US Dollar. The ETH/USD pair declined heavily, found support near the $126 level, and later bounced back. It settled above the $130 and $132 support levels. The recovery was strong as the price even moved above the $135 level. However, it found a lot of selling interest near the $139-140 resistance zone. There was also no close above the $138 level and the 100 hourly simple moving average.
A swing high was formed near $140 and later the price started trading in a range. It dipped below the 50% Fib retracement level of the last wave from the $126 low to $140 high. However, the decline was protected by the $131-132 zone. Moreover, the 61.8% Fib retracement level of the last wave from the $126 low to $140 high also acted as a support. At the outset, there is a short term breakout pattern formed with resistance at $136 on the hourly chart of ETH/USD.
If there is an upside break above the $136 and $137 resistance levels, the price could revisit the $140 zone. Having said that, a proper close above the $140 and 100 SMA is needed for buyers to gain traction. The next stop for buyers could be $144, where sellers may emerge. On the other hand, if there is a downside break below $133, the price could revisit the $130 support.

Looking at the chart, ETH price seems to be trading in a range above the $130 pivot level. It may continue to trade in a range before the next move either above the $137 resistance or towards the $130 support. The price action is positive, but a follow through above $137 and $140 is must for more upsides.
ETH Technical Indicators
Hourly MACD – The MACD for ETH/USD is currently flat in the bullish zone.
Hourly RSI – The RSI for ETH/USD climbed higher, but it is struggling to gain pace above the 50 level.
Major Support Level – $130
Major Resistance Level – $140
The post Ethereum Price Analysis: ETH Could Make Sustained Move Higher appeared first on NewsBTC.
from NewsBTC https://ift.tt/2NBQHoj
Comments
Post a Comment