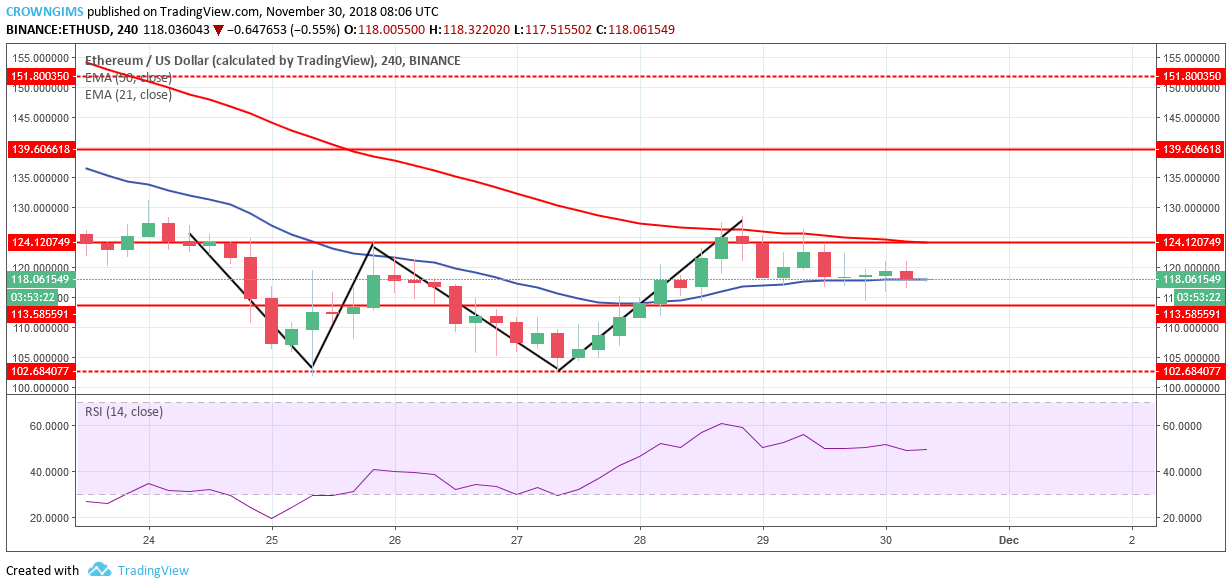

Supply levels: $124, $139, $151
Demand levels: $113, $102, $91
ETH/USD Medium-term Trend: Ranging

On the medium-term outlook, ETH/USD is ranging. There was a bullish momentum from the bottomed price level of $102 towards the supply level of $124 which serves as the last part to complete the “double bottom” pattern formed on the 4-Hour chart on the ETH market. The price was resisted by the dynamic resistant of 50-day EMA coupled with the barrier at the supply level of $124 and the price started consolidation within the range of $124 and $113 price level.
ETH price is trading within the 21-day EMA and 50-day EMA, with the two EMAs, parallel horizontally to each other as a sign of consolidation. Should there be a clear penetration above the supply level of $124, then the bullish rally will be anticipated towards the supply level of $139 – $51. A breakout below the demand level of $113 will further decline in price towards $102 – $91 price level. Meanwhile, the Relative Strength Index (RSI) is flat showing no direction indicate a continuation of the ranging movement
ETH/USD Short-term Trend: Ranging

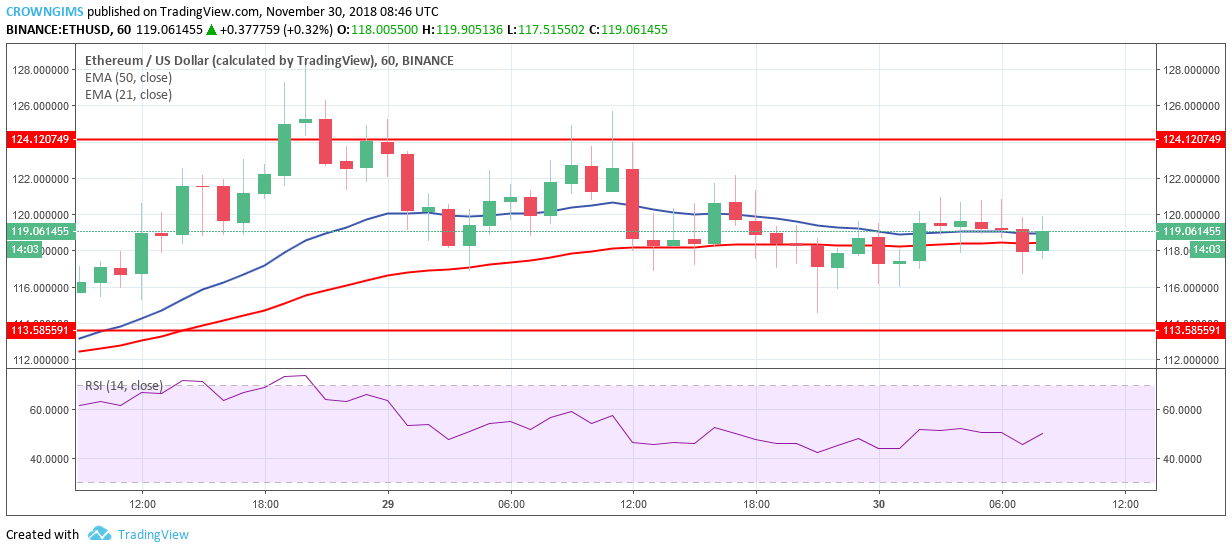
ETH is ranging in its short-term outlook. ETH started ranging within the price level of $124 and $113 on November 28, after the Bulls lost the momentum to push the coin farther above the supply level of $124.
The two EMAs are closed to each other with the ETH price on it which indicates that consolidation is ongoing. However, the Relative Strength Index (RSI) is above 40 level pointing upward which indicate buy signal. It is advisable for the traders to remain flat and wait for the breakout.
The post Ethereum Price Analysis | November 30, 2018 appeared first on ZyCrypto.
Comments
Post a Comment